An automated valuation model (AVM) estimates what a home is worth from data alone: past sales, property characteristics, location and market movement. No one visits the property. RICS noted in its 2022 insight paper that AVMs are widely used across most of the UK, with Northern Ireland the exception, where lenders do not use them.
For a broker, the AVM decides more than most clients realise. It can be the reason a remortgage case sails through or the reason it is sent for a full valuation and comes back lower than expected. When a figure is corrected late, the cost shows up as delay or renegotiation, a pattern we look at in how property data accuracy affects deal fall-throughs.
So how does an AVM arrive at a number, how far should you trust it, and where does it stop being the right tool?
What is an automated valuation model?
An automated valuation model is a statistical model that produces a property value estimate without a valuer's inspection. The output is usually a point estimate, a range and a confidence measure.
RICS cautions against treating every AVM as fully automatic. Its 2022 paper describes "a much broader spectrum of hybrids involving varying degrees of automation", from pure models to human-supported processes. It also asks whether an AVM output should ever be described as "market value" in the Red Book sense, and leaves that question open.
This article covers how the models work and where lenders use them. For how AI is changing broker and lender workflows more widely, see our earlier piece on AI property data for brokers and lenders.
How does an AVM work?
Most production AVMs combine three approaches and weight them by how much evidence exists for the property in front of them.
- Hedonic regression. RICS describes this as "a regression technique based on the hypothesis that assets can be treated as bundles of characteristics". The model learns what floor area, bedrooms, property type, age and location each add to price, then prices the subject home from its own characteristics.
- Repeat sales. Where the same property has sold before, the model takes the last price and moves it forward by the change in local prices since. It works well for ordinary homes that trade regularly and poorly for homes that have been extended or renovated since their last sale.
- Comparables. The model finds recent sales of similar nearby homes, scores how close each one is, and adjusts for differences. RICS lists the "scoring and identification of comparable evidence" as one of the core AVM tasks.
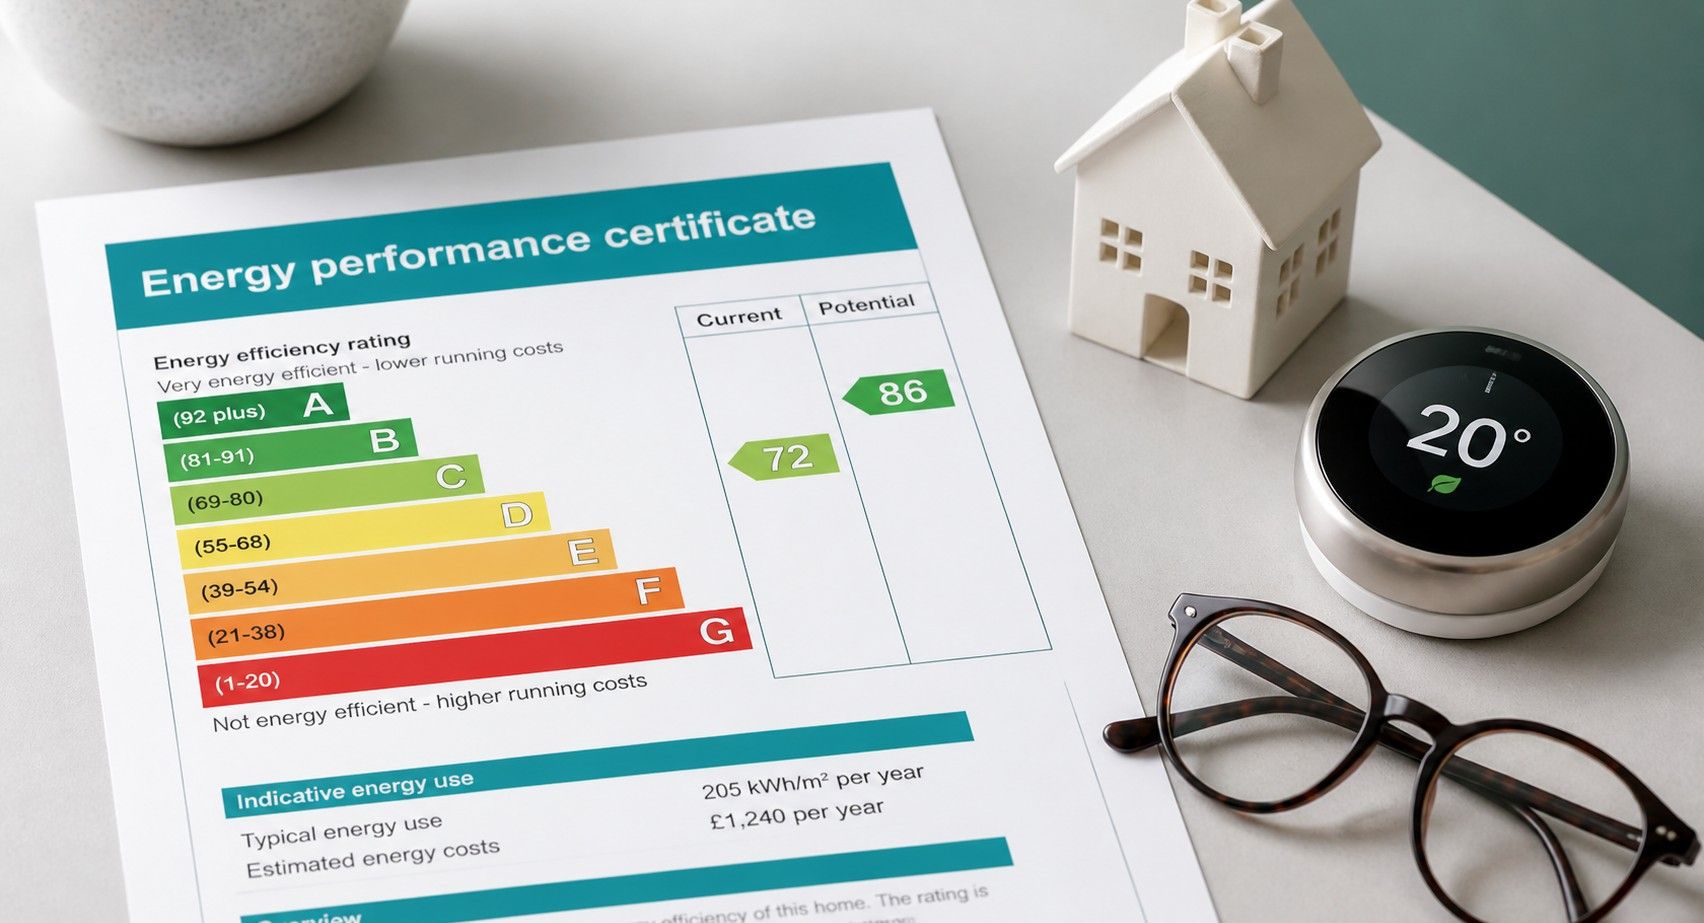
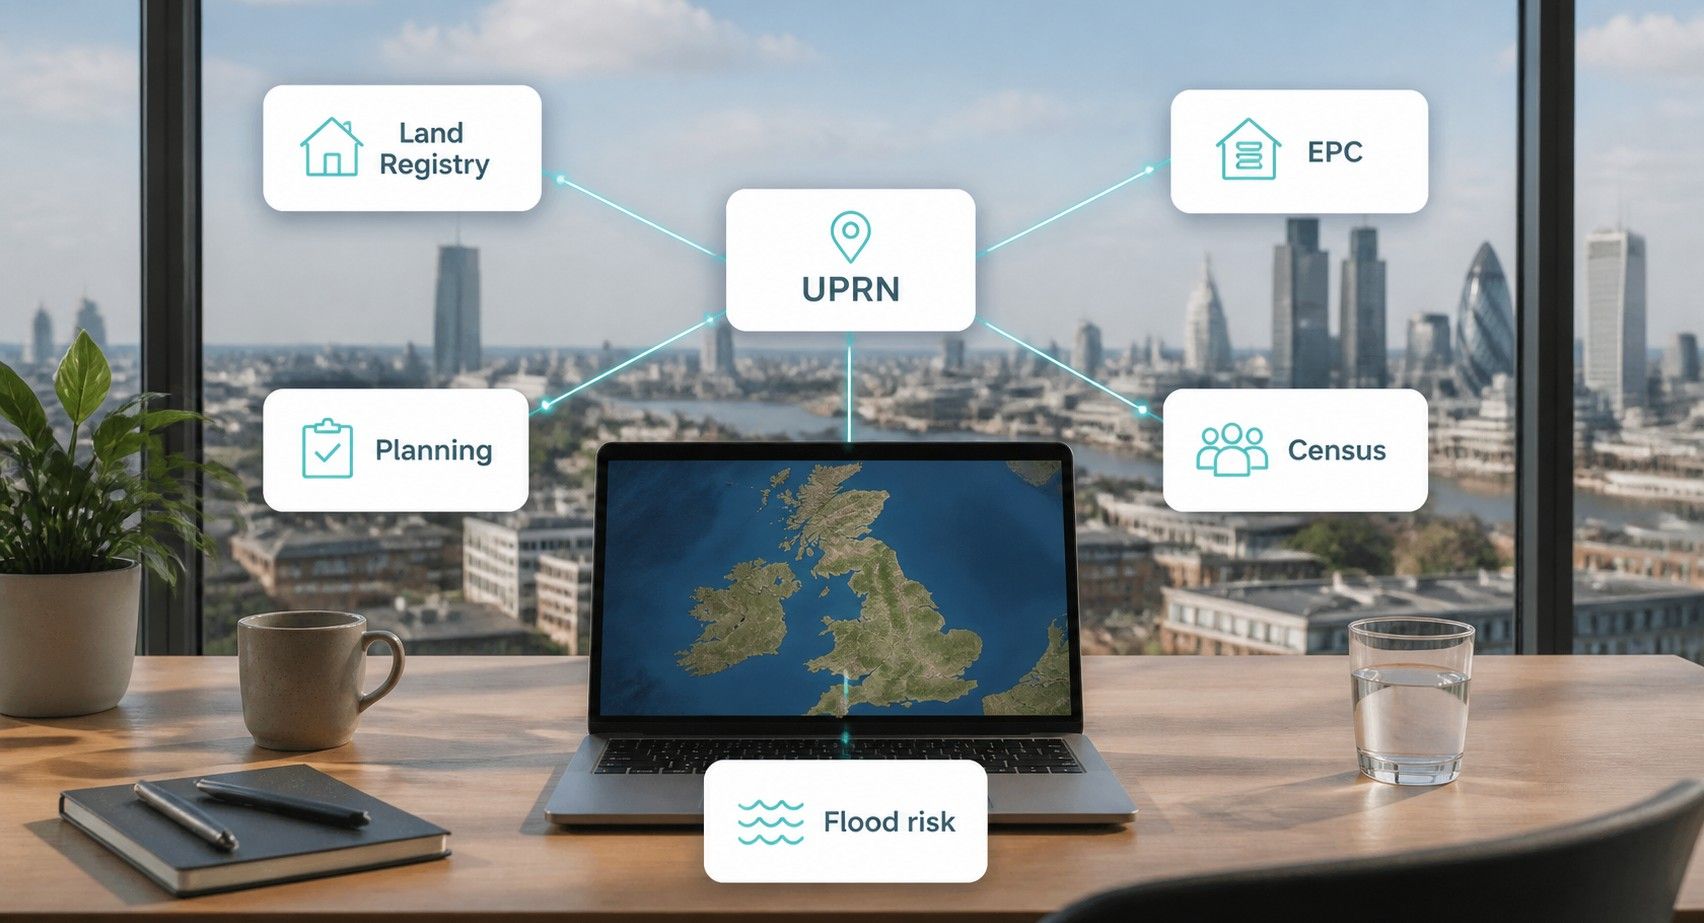
The inputs matter as much as the method. In England and Wales the transaction base is HM Land Registry Price Paid data, which records price and date but not floor area or bedrooms. Those come from EPCs, listings and other sources, matched to the property through its UPRN.
An AVM is only as good as the comparables it can see, and it cannot see a sale it has failed to match to the right property.
What do confidence scores and forecast standard deviation mean?
A confidence score tells you how much evidence sits behind a particular AVM valuation. Forecast standard deviation (FSD) is the statistic most confidence scores are built from.
Freddie Mac's collateral modelling team defines FSD as an AVM value's "expected (forecasted) proportional standard deviation around actual subsequent sales price". Expressed as a percentage, it reads like this: if the FSD is 10%, about 68% of actual sale prices should fall within plus or minus 10% of the AVM value, and a 1.28 standard deviation interval should contain about 80%.
Lenders rarely work with raw FSDs. Providers translate them into bands, and lenders write policy against the bands. A typical pattern is to accept a high-confidence band automatically, refer a middle band for review and escalate a low band to a valuer.
| FSD | What it implies (normal errors) | Typical lender treatment |
|---|---|---|
| Low (for example 8%) | Two thirds of outcomes within ±8% | Often accepted within policy limits |
| Medium (for example 15%) | Two thirds within ±15% | Referred, or accepted at lower LTV |
| High (for example 25%) | Two thirds within ±25% | Desktop or physical valuation |
Illustrative bands. Each lender sets its own thresholds.
Two points for brokers. A confidence score describes the model's certainty about this property, which is a different thing from the property's risk. And an AVM can be confident and still wrong if its comparables are stale.
Where do UK lenders use AVMs?
UK lenders use AVMs where the property risk is low relative to the loan and speed matters.
- Remortgage. RICS notes that "a lender may use an AVM to support their underwriting process" on remortgage. Where the AVM result falls within the lender's confidence and loan-to-value rules, it can stand in for a physical inspection; Mortgage Introducer described AVMs replacing drive-by and physical valuations as early as 2006.
- Further advances. The same logic can apply to additional borrowing on an existing mortgage, where the lender already holds a valuation history.
- Portfolio revaluation. Lenders must keep collateral values current. Under the Capital Requirements Regulation as applied in the UK, firms must "monitor the value of property on a frequent basis", and the PRA's 2020 Q&A confirms firms may use house price indices for this and that desktop and drive-by valuations may be used where appropriate. Indexation and AVMs let a lender revalue a whole book without instructing a valuer on every loan.
- Broker pre-checks. Brokers use AVM estimates to sense-check a client's expected value before submission, so a likely down-valuation shows up before the application rather than after it.
Where do AVMs fall down?
AVMs work best on ordinary homes in active markets. RICS puts it plainly: AVMs "work best with widely traded homogenous assets", and their "performance degrades with increasingly heterogenous assets or assets that are thinly traded".
- Unusual homes. Converted chapels, large plots, listed buildings and heavily extended houses have few true comparables. Hedonic models also miss quality and condition, which they cannot see.
- New build. A new home has no previous sale to index forward, and on a new scheme the nearest comparables may be other units on the same development, sold at developer prices.
- Thin markets. Rural areas and small towns with few sales a year leave the model stretching for comparables in time and distance, which is exactly where FSD rises.
- Fast-moving markets. RICS also lists bias, model drift and weaker performance during market volatility. A model trained on last year's prices lags a turning market.
Thin evidence can also be a matter of property type inside a busy area. In Propalt's quarterly market data for Q3 2026, the M14 outcode in south Manchester had 80 listings marked as sold, 52 of them terraced homes and one a detached house. A model valuing a detached home in M14 has to reach further in distance or time than one valuing a terrace on the next street.
The right question to ask of an AVM is how many recent, matched comparables it used for this property, and how far away they were.
How does an AVM compare with a desktop or physical valuation?
The three sit on a scale of cost, speed and evidence.
| AVM | Desktop valuation | Physical valuation | |
|---|---|---|---|
| Who produces it | A model | A valuer, remotely | A valuer, on site |
| Inspection | None | None | Internal and external |
| Uses judgement on condition | No | Limited, from data and images | Yes |
| Valuer accountable for the figure | No | Yes | Yes |
| Called "market value" | Open question (RICS 2022) | If instructed as a valuation | If instructed as a valuation |
| Best for | Low-LTV remortgage, revaluation, pre-checks | Mid-risk cases, portfolio reviews | Purchases, high LTV, unusual property |
The PRA's 2020 Q&A on CRR property valuations confirms that physical inspections are not required for revaluation reviews and that desktop and drive-by valuations may be used where appropriate. A desktop valuation keeps the valuer's judgement and accountability without the site visit.
What does an AVM look like through a property valuation API?
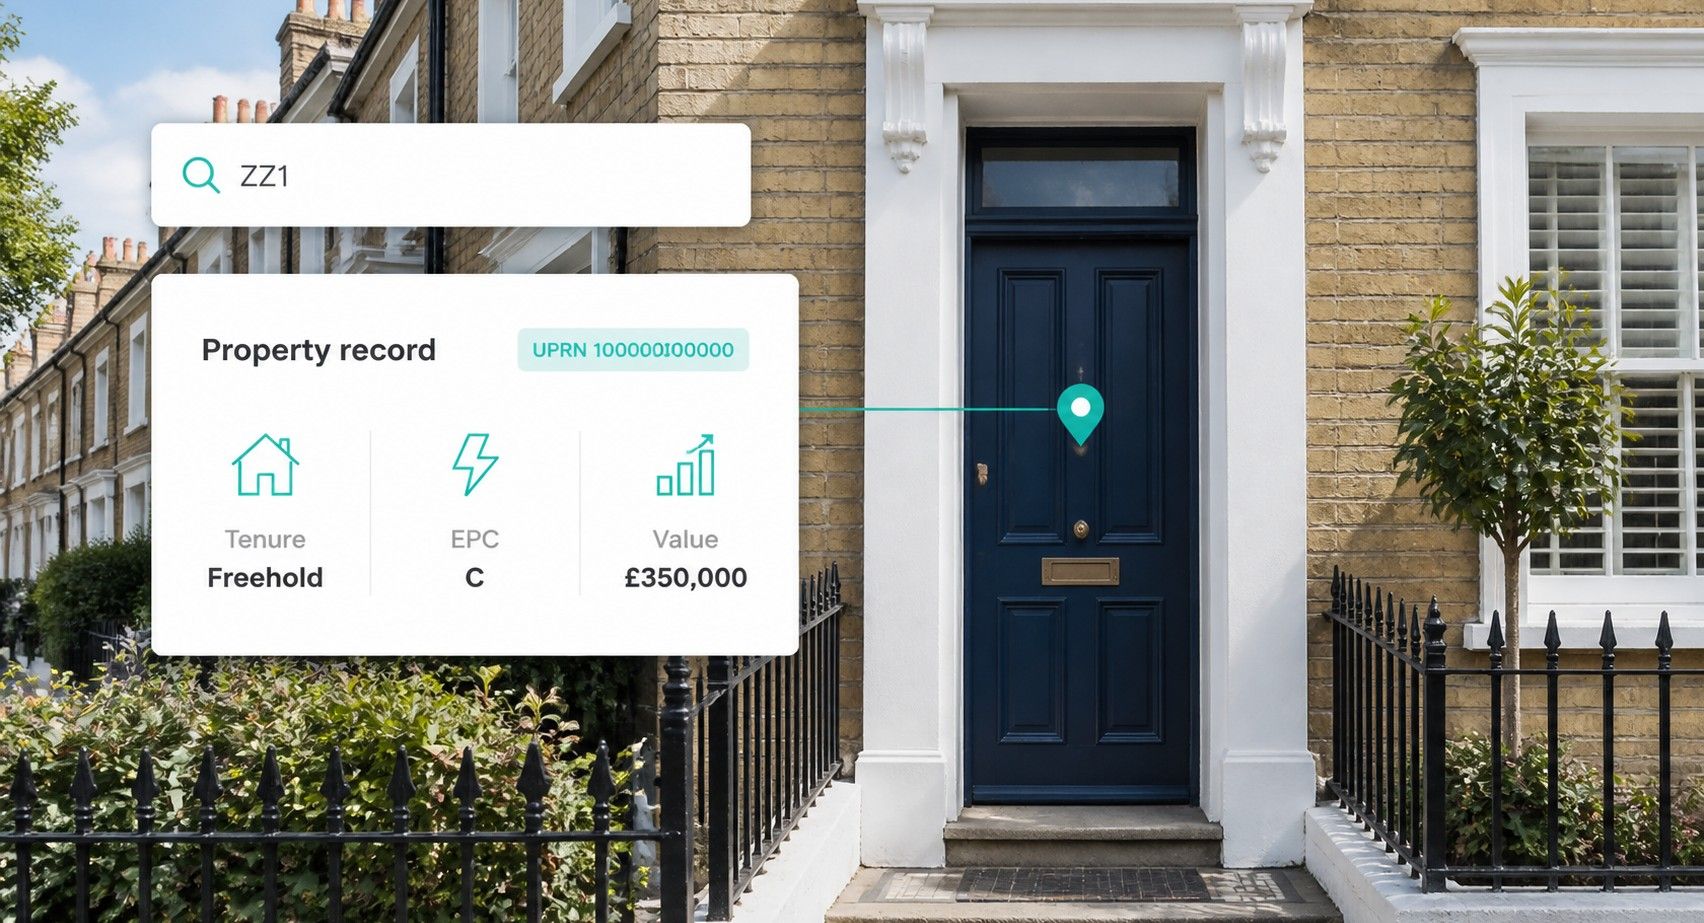
A property valuation API returns the estimate, its range and its confidence in one call, so the result can feed a decision engine directly. The example below uses the Propalt API at https://api.propalt.io with a placeholder UPRN. The Propalt AVM is Propalt's own automated valuation, not a surveyor or VOA figure.
import requests

BASE = "https://api.propalt.io"
HEADERS = {"Authorization": "Bearer YOUR_API_KEY"}
UPRN = 100000000000  # placeholder

# 1. Property record, including the AVM field
prop = requests.get(f"{BASE}/property/get-property",
                    params={"uprn": UPRN}, headers=HEADERS).json()

# 2. Valuation with range and confidence
val = requests.post(f"{BASE}/valuation/get-valuation-by-property-id",
                    json={"uprn": UPRN},
                    headers=HEADERS).json()

# 3. Sold comparables behind the estimate
comps = requests.post(f"{BASE}/comparables/get-comparable-by-property-id",
                      json={"uprn": UPRN, "type": "selling",
                            "current_status": 3, "return_amount": 10},
                      headers=HEADERS).json()
The valuation response returns a predicted price, an upper and lower band, a confidence level and price per square metre. The comparables call returns between 5 and 30 evidence properties, for sale or to let, filtered by status. The same calls run through the Propalt MCP server in Claude or ChatGPT if you would rather ask in plain English, and both routes draw on credit-based plans with a free allowance. Our developer guide covers getting started with the API.
📌 KEY TAKEAWAY
An automated valuation model blends hedonic regression, repeat sales and comparables, and its confidence score, usually built on forecast standard deviation, tells you how much evidence sits behind each estimate. UK lenders rely on AVMs for remortgages and portfolio revaluation, and send unusual homes, new build and thin markets to a valuer. Brokers who check the range and the comparables before submission see down-valuations coming, and propalt.ai returns the AVM, its band and its comparables through one API or MCP call.
SOURCES & DATA REFERENCES
- RICS (April 2022). 'Automated valuation models (AVMs): implications for the profession and their clients' (Insight paper). UK usage outside Northern Ireland, hybrid spectrum, hedonic method, comparable scoring, remortgage use, limits on heterogeneous and thinly traded assets, Red Book question. rics.org/content/dam/ricsglobal/documents/standards/april_2022_automated_valuation_models_insight.pdf
- Freddie Mac, Douglas Gordon (2005). 'Metrics Matter.' FSD definition and the 68% and 80% interval interpretation. sf.freddiemac.com/docs/pdf/fact-sheets
- Bank of England, Prudential Regulation Authority (29 May 2020). 'Q&A on CRR requirements for property valuations.' Frequent monitoring of property values, HPI use, desktop and drive-by valuations, no physical inspection requirement. bankofengland.co.uk/-/media/boe/files/prudential-regulation/publication/2020
- Gadsden Valuations (accessed October 2026). 'AVM Accuracy Metrics Explained.' FSD as a property-level measure and lender band policies (accept, review, escalate). valuations.andrewgadsden.com/knowledge/accuracy-metrics
- Mortgage Introducer, Grant Bather (August 2006). 'AVMs: the differences.' Confidence bandings derived from FSDs and portfolio revaluation use; dated market context. mpamag.com/uk/news/general/avms-the-differences/359311
- Propalt (October 2026). 'Valuation and comparables endpoint outputs: predicted price, upper and lower band, confidence level, price per square metre; comparables 5 to 30 properties by status.' Description of the Propalt AVM response. propalt.ai (Propalt API / MCP)
- Propalt (October 2026). 'Quarterly market analysis, Q3 2026, M14.' 80 listings marked as sold, of which 52 terraced and 1 detached. Propalt MCP, get_quarterly_market
Contains HM Land Registry data © Crown copyright and database right 2026. This data is licensed under the Open Government Licence v3.0.