You staffed for a busy August that the market had already told you was quiet
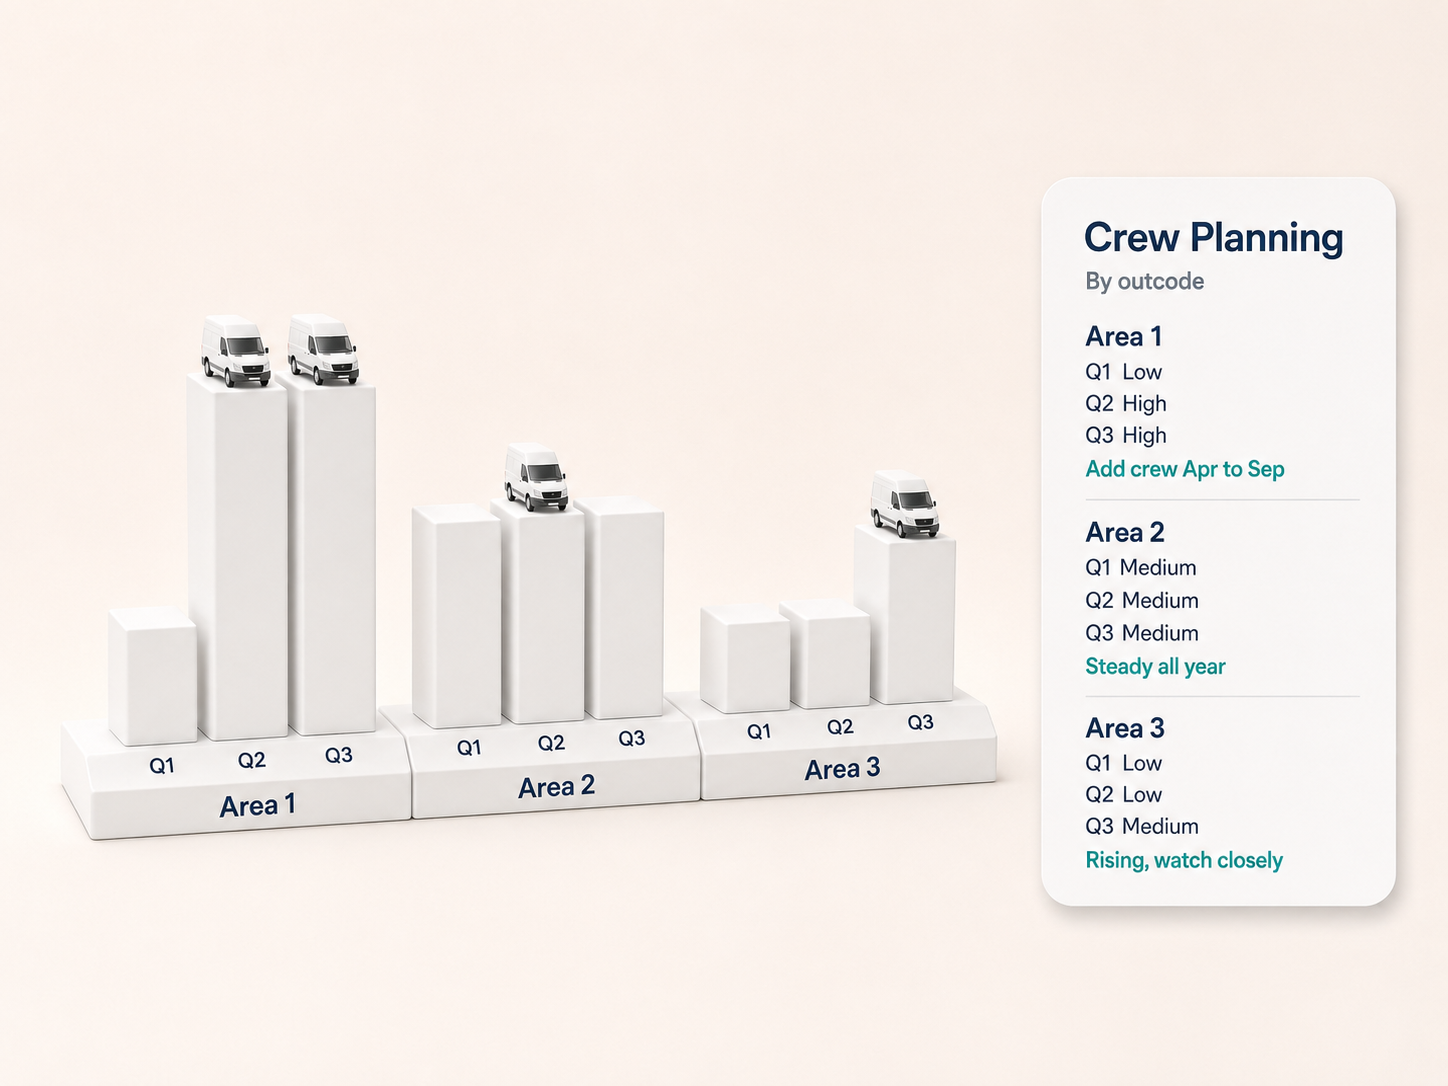
Transaction volume by outcode over time, so crews and van hire are staffed against the areas and months that generate work.
Propalt Team · For removal companies
Staffing a removal firm is a guessing game for most operators. You look at last year, add a bit for the spring rush, keep a couple of crews on standby, and hope the bookings match. Some weeks you are turning work away because everyone is out. Others you are paying wages and van hire to sit in the yard. Both are the same mistake: staffing on memory instead of on what the market is actually doing.
Moves follow the property market, and the property market leaves a trail. Every completed sale is a move that had to happen, and the volume of those sales rises and falls by area and by month in a pattern you can read. Plan against that pattern and your capacity starts to line up with demand, instead of chasing it a fortnight late.
Volume by outcode is the roster you have been missing
It is true that transaction data cannot tell you the exact day a given household books, and there will always be a week that surprises you. But over a month and across an outcode, sales volume is a steady signal. It tells you which areas generate the most moves and which months they cluster in, which is precisely the information a staffing plan needs and precisely what gut feel gets wrong.
Look at transaction volume by outcode over time and the shape of your year appears. You can see that one district completes twice as many sales as another, that spring and late summer carry the load while midwinter dips, and that a particular area has been climbing quarter on quarter. That is the difference between staffing for the town in general and staffing for the parts of it that actually book vans.
| Outcode (illustrative) | Q1 volume | Q2 volume | Q3 volume | Crew planning note |
|---|---|---|---|---|
| Area 1 | Low | High | High | Add crew Apr to Sep |
| Area 2 | Medium | Medium | Medium | Steady all year |
| Area 3 | Low | Low | Medium | Rising, watch closely |
The figures above are illustrative. The value is in the pattern: it comes from real transaction volume by outcode, not last year's impression, so your roster and your van hire are matched to where and when the moves actually happen.
From a seasonal picture to a staffing decision
A market picture is only useful if it changes what you do. Read the outcode volumes together with the wider market analysis and you can make real decisions: put extra crews on for the months an area peaks, hold back agency and van hire through the genuine lulls, and lean coverage towards the districts that generate the most work rather than spreading thin across the whole patch.
It also sharpens the longer view. An outcode climbing quarter on quarter is telling you where to build capacity next year, before the demand arrives. A district drifting down is telling you not to overcommit there. This is all area-level market data, with no personal detail involved; it is simply the volume of moves, mapped to where and when they happen, so your staffing follows the work instead of last year's guess.
Staff for the market the data shows, not the one you remember.
Standby crews and idle vans are the cost of planning blind. Match your capacity to real transaction volume, by area and by month, and you spend on wages when the work is there and hold back when it is not.
Roster to the volume, not to the memory of last summer.
Try the Crew coverage planner → · propalt.ai
Transaction volume and market-analysis data is drawn from the Propalt intelligence layer. No personal data is used; all work is at area and outcode level. Figures shown are illustrative. This article is general information for removal company professionals.
Crew coverage planner
Maps transaction volume by outcode over time, so you can staff crews and van hire for the areas and months that actually generate moves rather than for last year's gut feel.
🎯 Best used for
Planning crew and van capacity against demand
🔌 Propalt APIs used
get_monthly_market get_market_analysis