The smart money leaves a paper trail. You can read it.
Ownership and portfolio records show which landlords and companies are accumulating in an outcode, months before the movement reaches headline prices.
Propalt Team · For property investors
Sourcing usually treats the market as if you are the only investor in it. You find a property, run the numbers, and decide. What that misses is that other landlords and companies are running the same exercise across the same outcodes, and their decisions leave a record. Every purchase registers an owner. Aggregate those owners and you can see, at outcode level, where portfolio buyers are quietly building and where they are not.
That is not a substitute for your own diligence. A postcode filling up with buy-to-let purchases can also be a sign of a bubble rather than an opportunity, and following money blindly is how you end up buying the top. But used properly, competition data is one of the few forward signals you get. Professional landlords tend to know an area before the wider market does, and their accumulation shows up in the ownership records months before it shows up in headline prices.
Read the accumulation, not just the asking prices
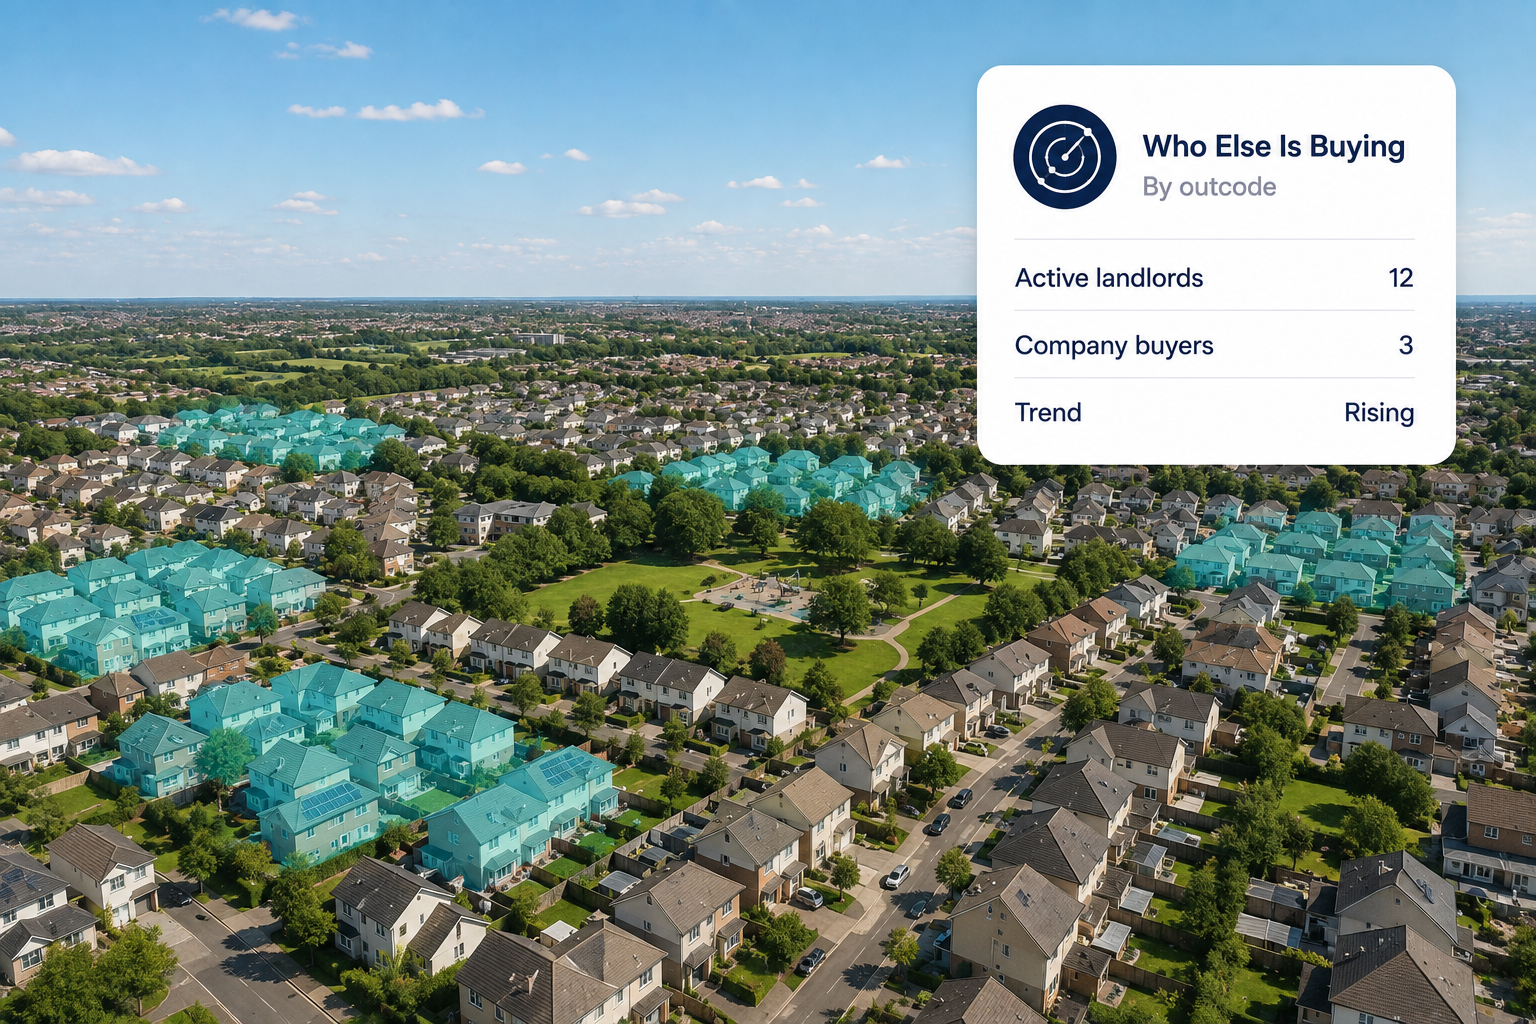
A competition radar turns ownership and portfolio records into a picture of who is active in an outcode. It shows which individual landlords and which companies are adding properties, how concentrated ownership is becoming, and whether the buying is spread across many small owners or driven by a handful of larger players. Those two patterns mean very different things for you.
An outcode where several established portfolio landlords are adding steadily is one where people who do this for a living see something. An outcode where one company is hoovering up stock might be an area about to be regenerated, or one where you will struggle to compete on price at auction. Either way, knowing before you bid is better than finding out afterwards when your offer is beaten by someone who saw the play earlier.
| Outcode (illustrative) | Active landlords | Company buyers | Concentration | Trend |
|---|---|---|---|---|
| Outcode A | 12 | 3 | Spread | Rising |
| Outcode B | 5 | 1 | One dominant | Rising fast |
| Outcode C | 4 | 0 | Spread | Flat |
The figures are illustrative. Outcode B is the one to look at hardest: fast accumulation driven by a single buyer is a signal that demands an explanation before you follow it.
Turn the market's activity into your edge
The value here is timing. Portal prices tell you where the market has already been. Ownership activity tells you where capital is moving now, before the price catches up. Checking the radar before you commit to an outcode means you are sourcing with the same information the professionals in that area are acting on, rather than a step behind them.
By the time an area is obviously hot on the portals, the people who made the money bought it a year ago.
Use it as one input among several, alongside your yield and area checks, and it stops the market being a thing that happens to you and starts making it a thing you can read.
Watch where the money goes before you follow it.
Try the Landlord competition radar → · propalt.ai
Ownership, portfolio and market activity data is drawn from HM Land Registry, Companies House and the Propalt intelligence layer. Figures shown are illustrative. This article is general information for property investors.
Landlord competition radar
Turns ownership and portfolio records into a view of which landlords and companies are accumulating in an outcode, so you can see where capital is already moving.
🎯 Best used for
Spotting where investor money is concentrating
🔌 Propalt APIs used
audience_landlords get_market_activity_get_company_properties