The region you gave your best installer had almost none of the right stock
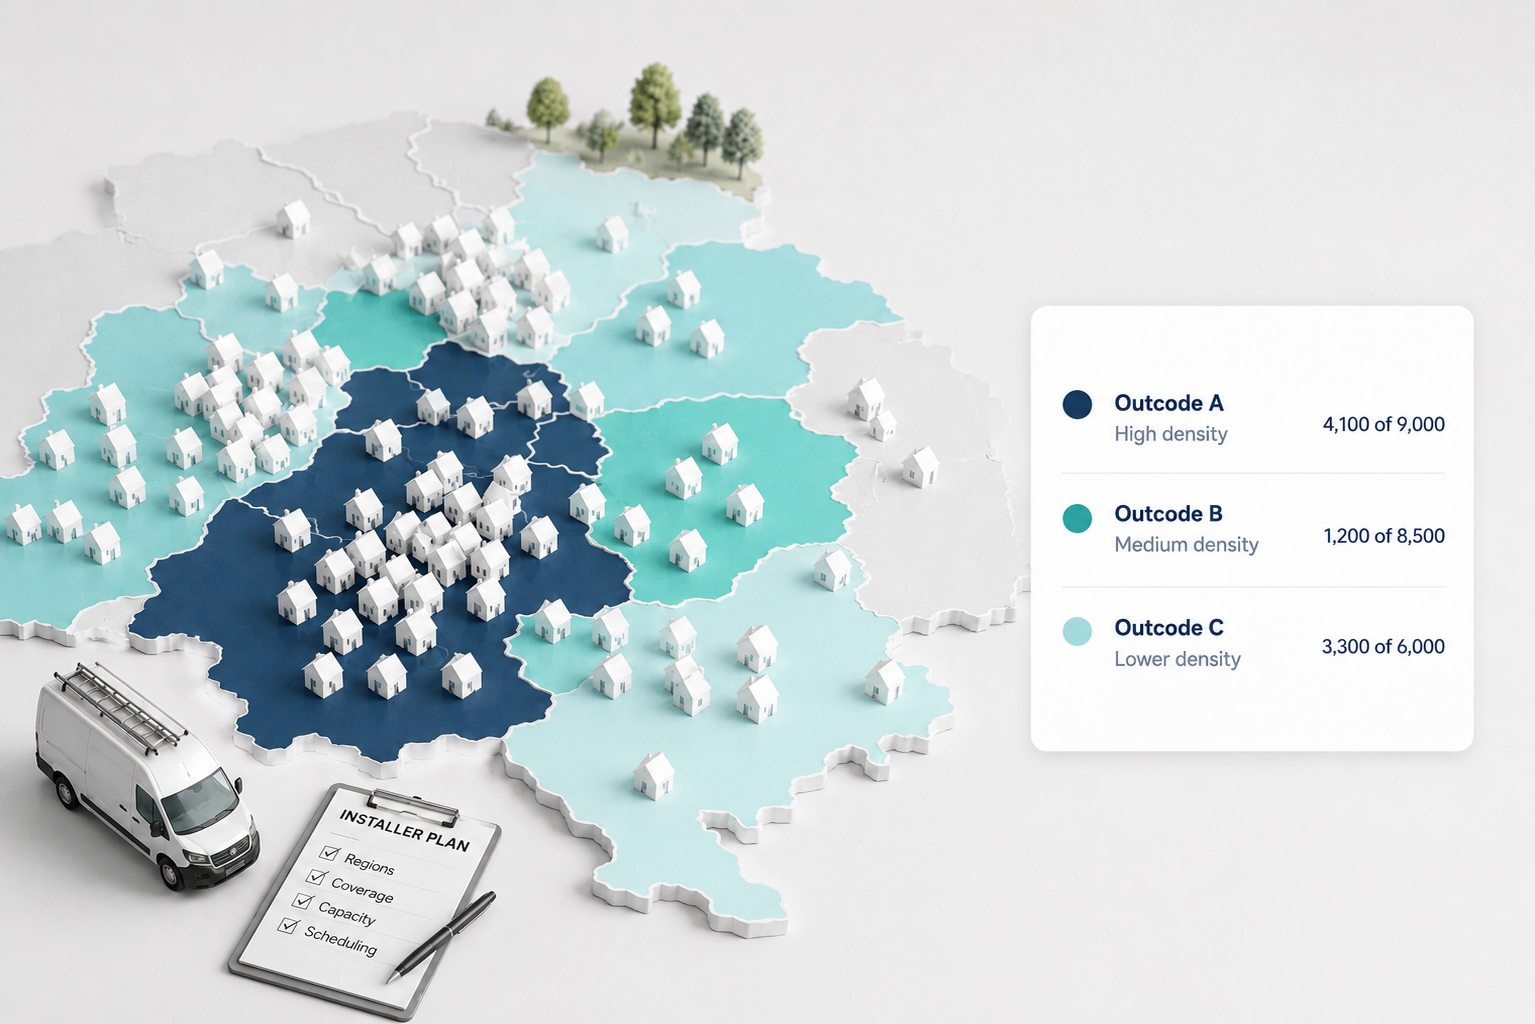
Qualifying property density by outcode from fabric records, so installer regions are sized to the work they contain.
Propalt Team · For home improvement and retrofit installers
Coverage planned on a map looks tidy and performs badly. The region is drawn to balance travel time and postcode count, the installer is assigned, and only later does it become clear that the patch is mostly new builds and flats with almost no stock the product suits. The neighbouring region, drawn smaller because it looked busy, turns out to hold most of the qualifying properties, and one installer cannot keep up.
Drawing regions is not the mistake. Drawing them by area rather than by opportunity is. Two outcodes of the same size can hold wildly different amounts of the housing stock your measure fits, and a plan that counts postcodes instead of candidates puts capacity in the wrong place.
Density, not distance
Plan coverage against where the suitable stock actually sits. Fabric records let you count qualifying properties by outcode, the addresses with the wall types, roofs and heating systems your product suits, and that count is the real measure of how much work a region holds. An outcode dense with qualifying stock deserves more installer time than a larger one that is mostly new build, whatever the map suggests.
Balance the regions on that density and the workload evens out. The installer in the high-density outcode is no longer overwhelmed, the one in the sparse patch is no longer idle, and the travel-heavy region that looked productive gets sized to the work it genuinely contains.
| Outcode (illustrative) | Total properties | Qualifying stock | Density | Coverage |
|---|---|---|---|---|
| Outcode A | 9,000 | 4,100 | High | Two installers |
| Outcode B | 8,500 | 1,200 | Low | Shared cover |
| Outcode C | 6,000 | 3,300 | High | One installer |
The table above is illustrative. What matters is that coverage is sized by qualifying density from fabric records, so installers are placed where the suitable stock is, not where the map lines happened to fall.
Plan against the work that exists
The planner returns qualifying property density by outcode, so regions are built from opportunity rather than geography. The operations lead can balance workload, place new hires where demand is real, and stop paying for coverage in areas that were never going to keep an installer busy.
A region is only as good as the qualifying stock inside it.
That is the point of planning on density. You are not drawing neat lines on a map. You are matching capacity to the work that actually exists, so every installer region is sized to the stock the product can serve.
Plan coverage on density, not on distance.
Try the Installer coverage planner → · propalt.ai
Property and fabric data is drawn from the EPC register and the Propalt intelligence layer. Results are screening indicators, not eligibility decisions. Figures shown are illustrative. This article is general information for home improvement professionals.
Installer coverage planner
Counts qualifying property density by outcode from fabric records, so installer regions are planned against where the suitable stock actually sits rather than where the map lines fall.
🎯 Best used for
Planning installer regions and capacity
🔌 Propalt APIs used
search_properties get_epc_fabric_by_postcode