Planning a region gets the total right and the deployment wrong
Property age, tenure mix, EPC distribution, household composition and income context at LSOA and outcode level, so capacity is booked against real density.
Propalt Team · For utility companies
Regional planning is comfortable because the numbers add up. You know how many properties sit in a region, roughly how many suit a given programme, and how much capacity to book against the total. The trouble is that a region is not where the work happens. Installers turn up at streets, printers post to addresses, and field teams walk specific areas. Plan at the regional level and the total is right while the deployment is a guess.
That guess is expensive in both directions. Book too much capacity into a thin area and it sits idle. Book too little into a dense one and the programme stalls where demand is highest. Regional totals are a fine starting point. Treating them as a deployment plan is the step that turns a good budget into a bad rollout.
Density lives at LSOA and outcode level
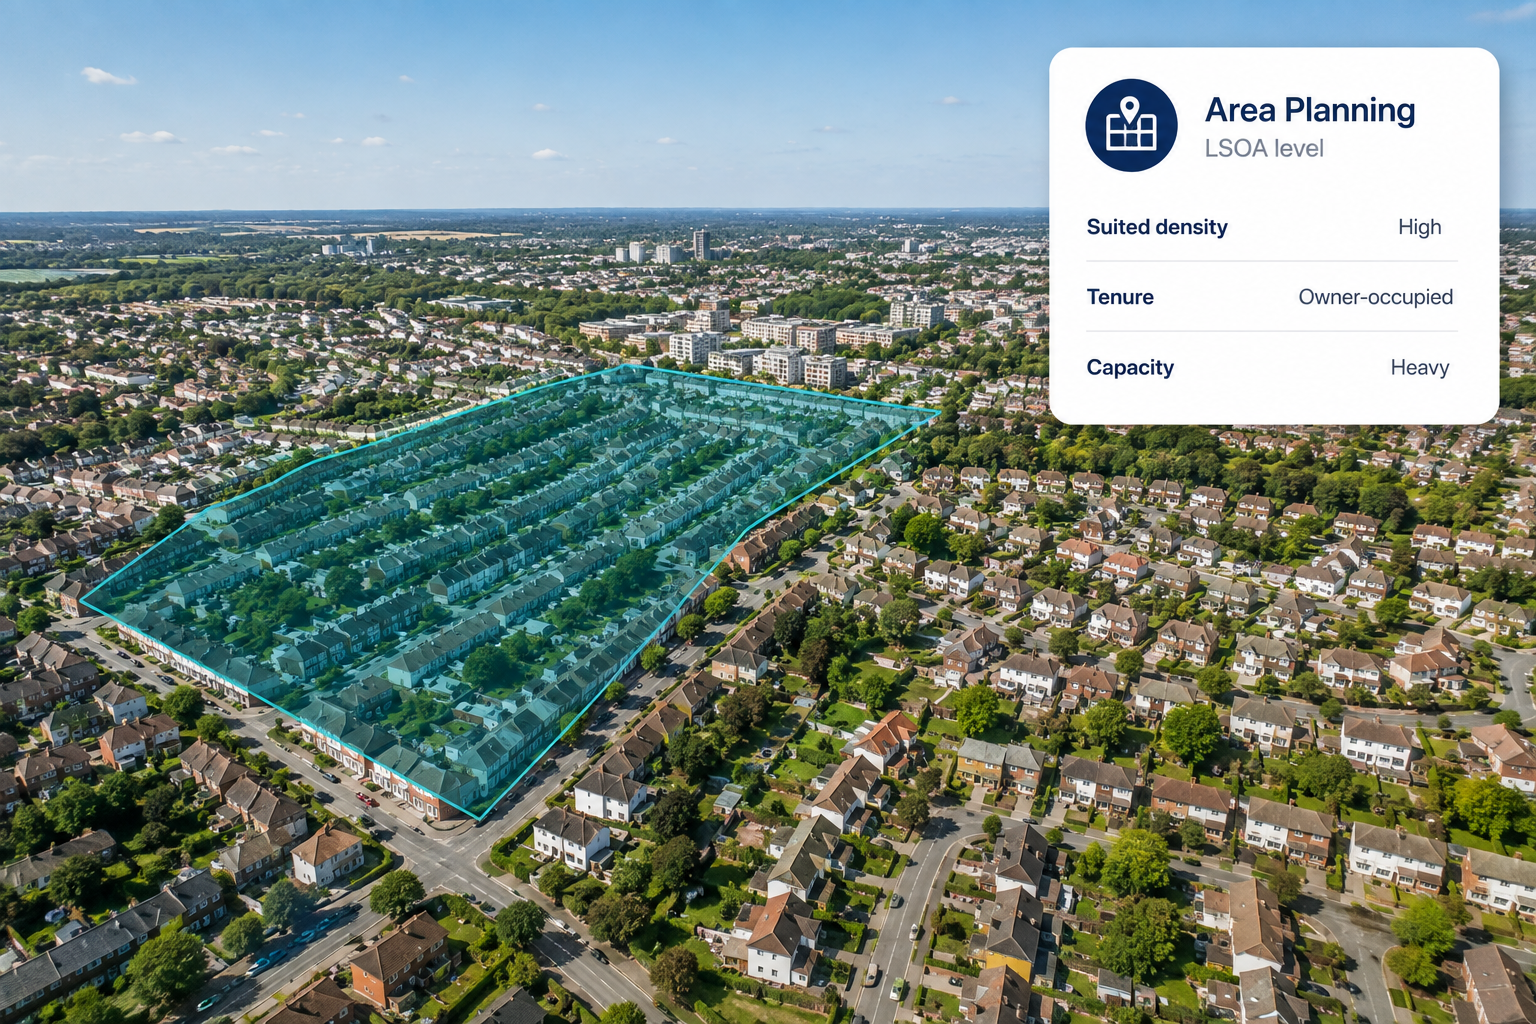
The detail that decides deployment sits below the region: property age, tenure mix, EPC distribution, household composition and income context, all readable at LSOA and outcode level. That is granular enough to show where the properties suited to a programme actually cluster, rather than assuming they are spread evenly across a region.
With that view, capacity follows density. A dense pocket of older, low-EPC, owner-occupied stock gets the installer slots and the print run it can absorb. A thin area gets planned lightly. The same regional budget lands where the properties are, not where the map is largest.
| Area (illustrative) | Suited property density | Tenure mix | Income context | Capacity to book |
|---|---|---|---|---|
| LSOA A | High | Owner-occupied | Mid | Heavy |
| LSOA B | Medium | Mixed | Mid | Moderate |
| LSOA C | Low | Rented | Mixed | Light |
The example above is illustrative. What matters is that the plan is built from area-level density and context, not a regional average spread evenly across every street.
One view for field, print and installers
Because the same area view drives all three, the plan stops contradicting itself. The print run, the field walk and the installer diary are booked against the same density picture, so the leaflets, the doorstep and the fitting slots all point at the same clusters. That coherence is what stops a programme spending in one area and delivering in another.
A region tells you how much to spend. An area tells you where to put it.
Planned at LSOA and outcode level, the same view scales up cleanly to the regional total when you need to report it, without losing the detail that made the rollout work.
Plan against real density, not the size of the map.
Try the Area capacity planner → · propalt.ai
Property, demographic and income context is drawn from the EPC register and the Propalt intelligence layer, with area-level income and vulnerability context added where relevant. These are property signals, not eligibility decisions. Figures shown are illustrative. This article is general information for utility acquisition and planning teams.
Area capacity planner
Reads property age, tenure mix, EPC distribution, household composition and income context at LSOA and outcode level so field, print and installer capacity is planned against real density.
🎯 Best used for
Planning rollout capacity by area
🔌 Propalt APIs used
get_demographics get_income get_epc_fabric_by_postcode