Your regional limits look fine. Your outcodes might not.
Why concentration risk hides one level below the geography you report on.
Propalt Team · For secured lenders
A concentration report built on regions can pass every limit while a real cluster sits underneath it. A region is large enough to contain both a market that is moving and one that is stalling, and the average of the two looks unremarkable. The exposure that would hurt you in a downturn is rarely spread evenly across a region; it collects in particular outcodes, around particular stock types, and the reporting geography is too coarse to show it.
The fair point is that regional reporting is standard, comparable and easy to govern, and it is not going away. But regional limits and outcode-level visibility are not in competition. You can keep reporting at the level your framework requires and still look one level down to see where the exposure actually clusters, so the limit that looks comfortable is not hiding a pocket that is not.
Exposure is only half the map
Knowing you hold a large share of loans in one outcode tells you where the eggs are. It does not tell you how fragile the basket is. The same concentration is a very different risk in an outcode where transactions are frequent and properties reach sold subject to contract quickly than in one where volume is thin and time to sold is stretching. Liquidity, not just size, is what turns a concentration into a problem when you need to realise collateral.
Mapping exposure against local price movement, transaction volume and time to sold subject to contract gives you the second half of the map. An outcode with heavy exposure but healthy turnover is a manageable position. An outcode with the same exposure, falling prices and lengthening sale times is where a concentration limit earns its keep.
| Outcode (illustrative) | Share of book | 12m price move | Transaction volume | Time to SSTC |
|---|---|---|---|---|
| Outcode A | 9% | +2% | High | 38 days |
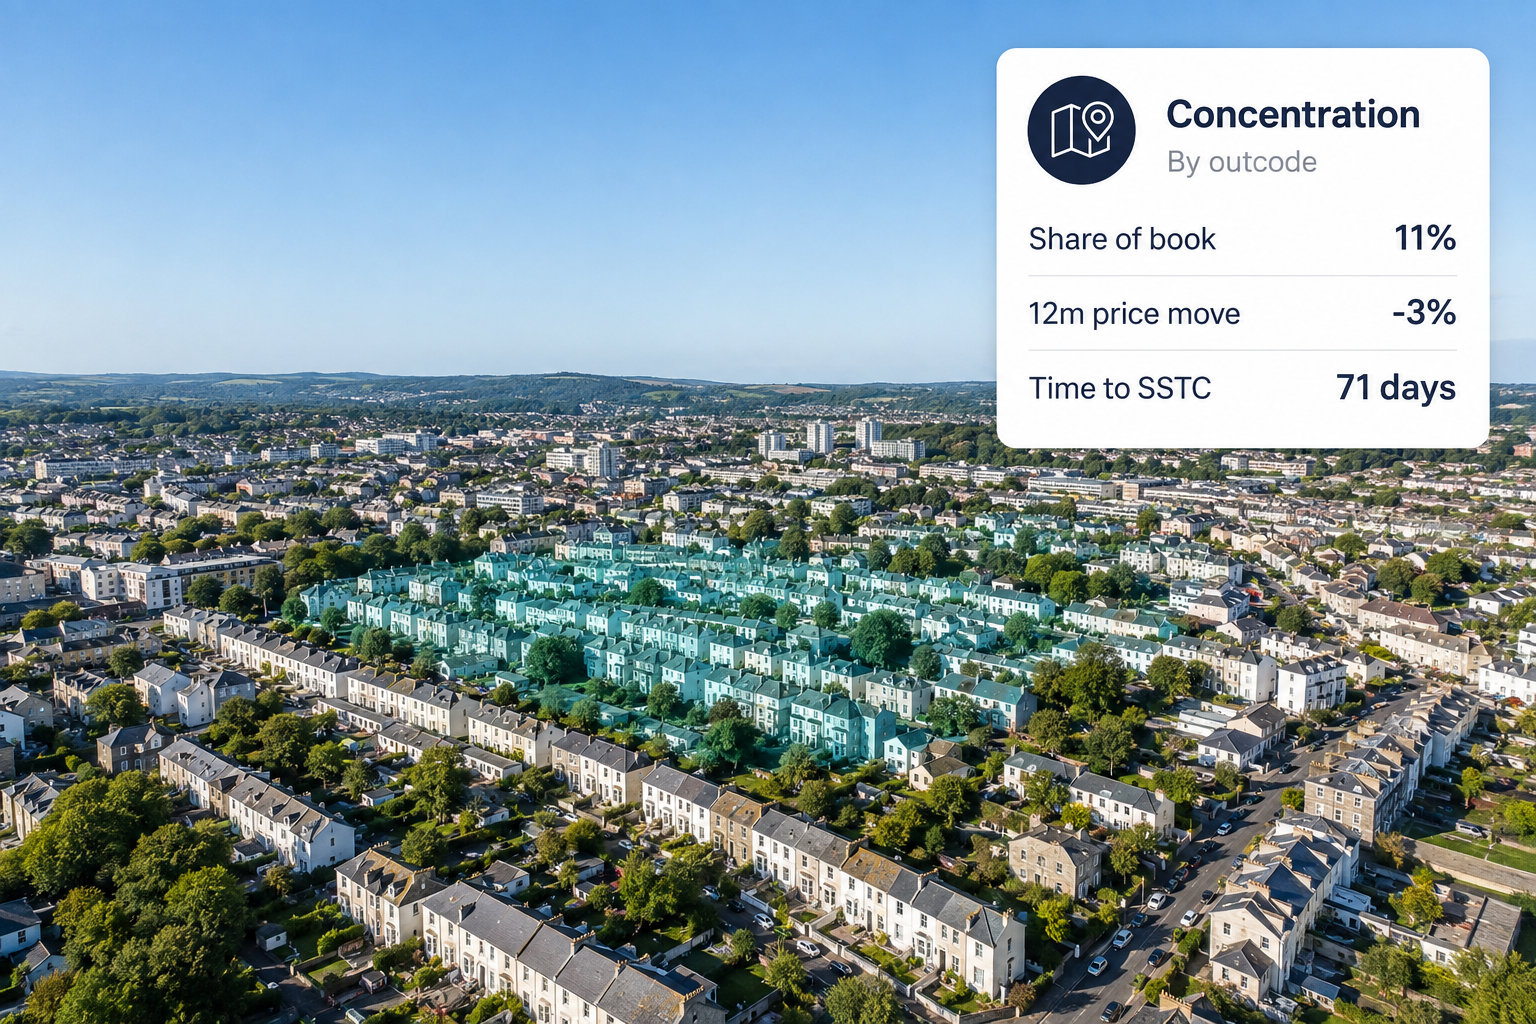
| Outcode B | 11% | -3% | Low | 71 days |
| Outcode C | 6% | 0% | Medium | 49 days |
The table is illustrative. Outcode B carries less of a headline concern than A on price, but the combination of exposure, falling prices, thin volume and slow sales is the row worth attention.
Clustering the regional view averages out
The value of dropping to outcode level is that it un-averages the region. Two outcodes pulling in opposite directions cancel out in a regional number and both disappear. Seen individually, one is fine and the other is the concentration you would want flagged. The regional view was never wrong; it was just too coarse to be actionable.
For the risk function this supports a more defensible position. Under PRA expectations around concentration and stress, being able to show where exposure clusters at fine geography, with the liquidity signals that determine how a cluster behaves under stress, is a stronger footing than a set of regional limits that were all comfortably within bounds. When the question is where the book is most exposed, the honest answer usually lives at outcode level, not regional.
A region can hold a healthy market and a stalling one at once, and report the average of both.
Map the clusters, not the averages.
Try the Concentration risk mapper → · propalt.ai
Market and price data is drawn from HM Land Registry and the Propalt intelligence layer. Figures shown are illustrative. This article is general information for lending risk professionals.
Concentration risk mapper
Maps book exposure at outcode level against local price movement, transaction volume and time to sold subject to contract, surfacing the clustering a regional view hides.
🎯 Best used for
Outcode-level concentration and liquidity risk mapping
🔌 Propalt APIs used
get_monthly_market get_hpi